
I was checking the Power Platform admin centre recently and spent some time in Dataverse analytics. If you haven’t looked at it yet, it’s useful, especially since you don’t need to install anything anymore.Everything is built in now. You just sign in to the admin centre, go to Manage, pick Dataverse, and the reports are already there.
Who Can See It
Access depends on your role. If you’re an Environment Admin, you’ll only see the environments you manage. Power Platform admins, Dynamics 365 admins, and Global admins can see everything. Nothing unusual here.
What It Shows:
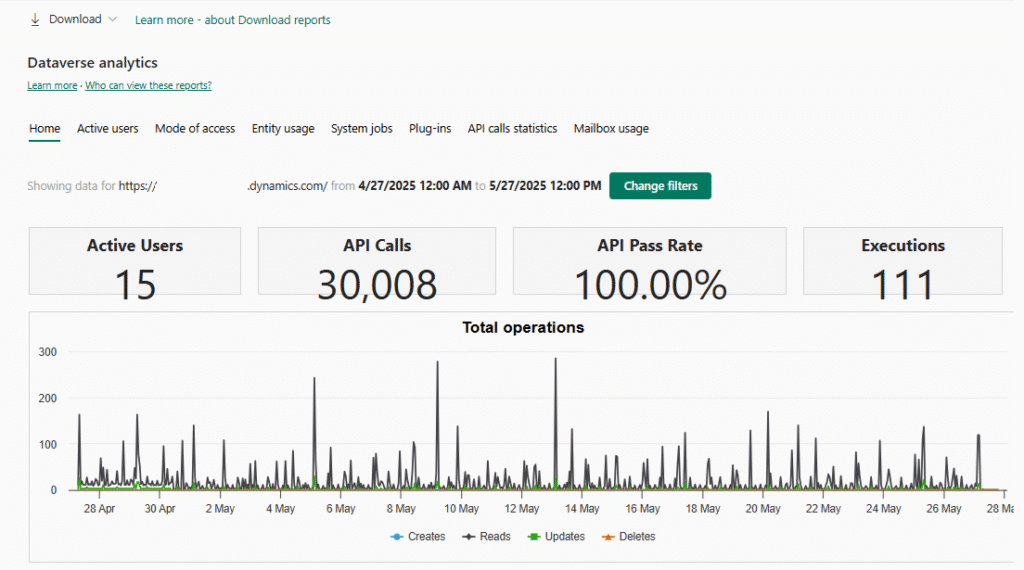
The first thing you notice is the home page. It gives you a rough idea of what’s happening in your environment.
You can see how many users are active, how many API calls are being made, which workflows are running the most, and whether plug-ins are failing. It’s not meant to be deep analysis, but it’s good for spotting problems early.
User Activity
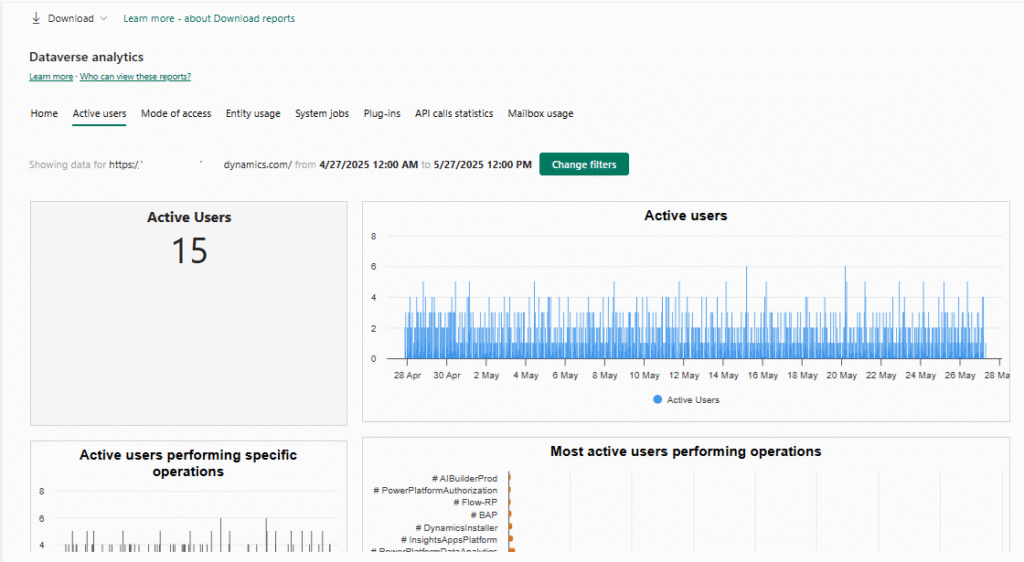
The Active Users section is where it gets more interesting. You can see how many users are actually doing something in Dataverse and what kind of operations they’re performing. Creates, updates, reads, deletes—it’s all there.
You can also see which entities are used the most, including custom ones. That alone helps answer a lot of questions about adoption. There are also breakdowns by browser, device type, operating system, business unit, and security role. This is handy when someone asks why licenses are being used or whether people are logging in.
Workflows and Plug-ins
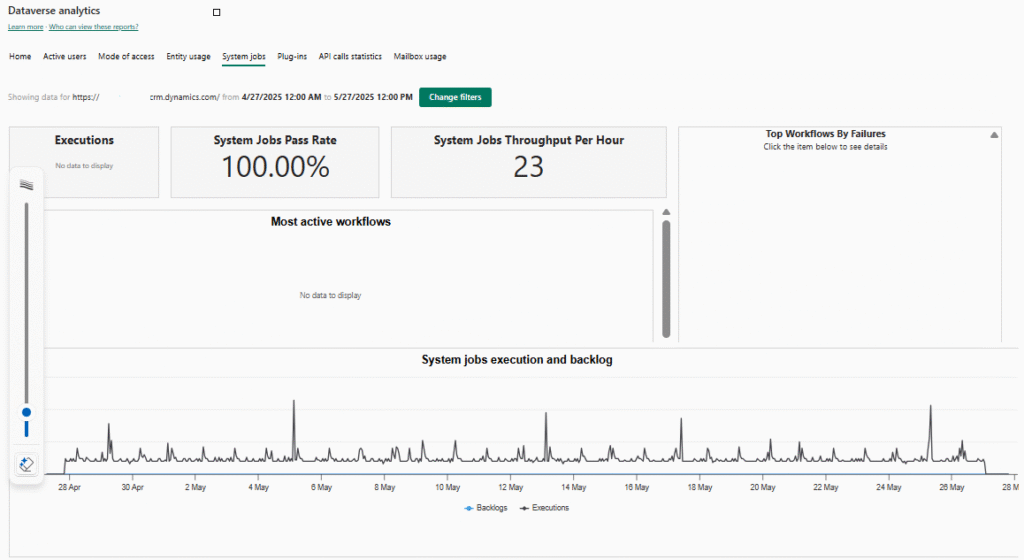
There are separate pages for system jobs and plug-ins. for workflows, you can see how often they run, how many fail, and which ones fail the most. If something keeps breaking, it shows up pretty quickly.
For plug-ins, you get execution counts, success rates, and average execution time. If performance is slow, this is usually where you find the reason.
API Usage
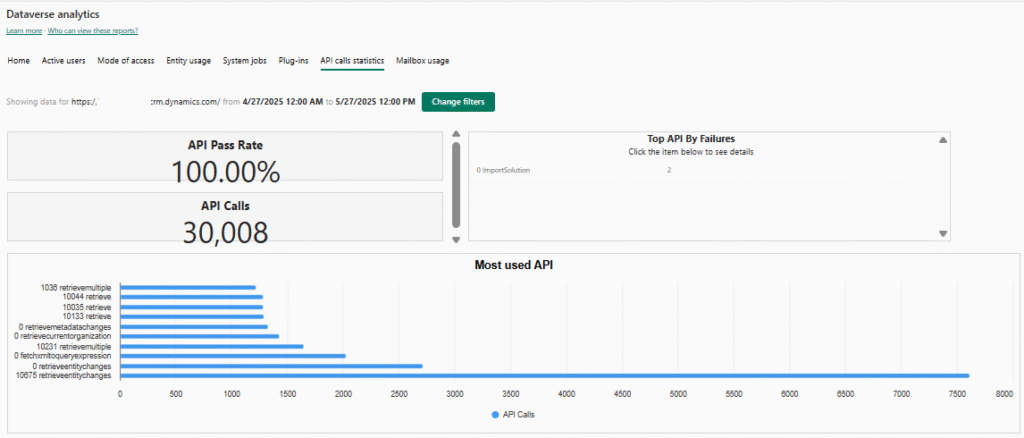
The API reports show how many calls are being made, which APIs are used the most, and which ones fail. There’s also a peak call rate view that helps you see when usage is getting close to service limits. This is especially helpful if you have integrations or custom apps hitting Dataverse a lot.
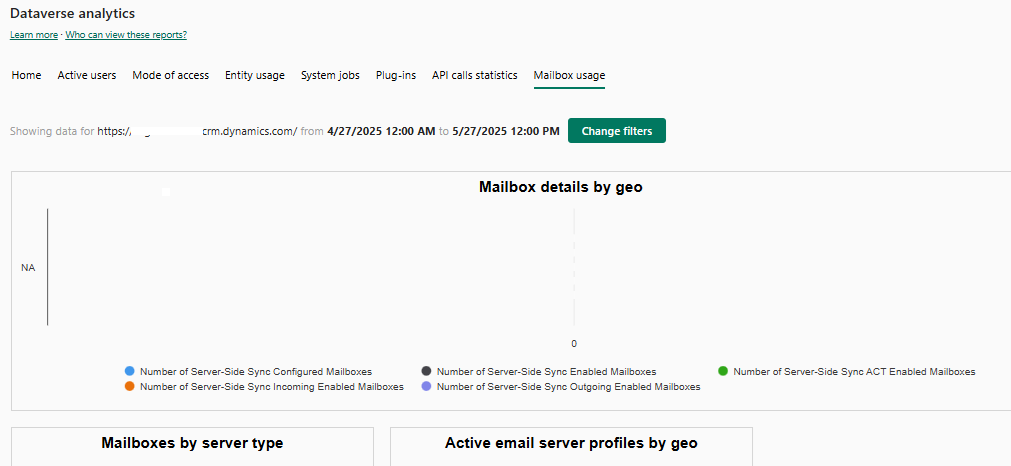
Mailbox Information
If your organization uses server-side sync, there’s a mailbox dashboard too. It shows how many mailboxes are configured, where they’re hosted, and whether there are configuration errors. Nothing fancy, but useful.
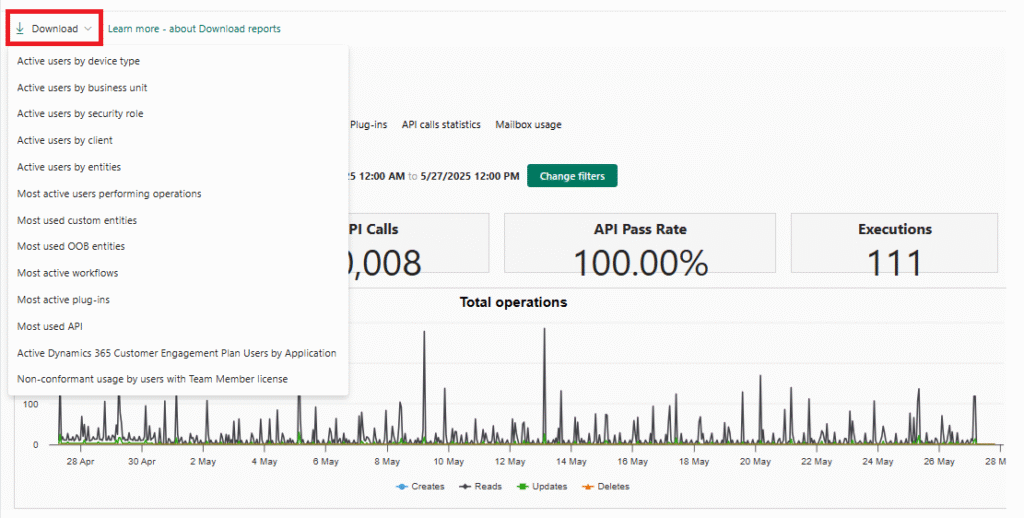
Downloading the Data
You can download most of these reports to Excel. The downloads follow the same environment and date filters you select in the UI. Usually, you’ll get up to 30 days of data, which is enough for reviews or audits.
Final Thoughts
Dataverse analytics isn’t flashy, but it does the job. It gives you visibility into how your environment is being used and where things might be going wrong. If you manage Dataverse regularly, it’s worth checking every now and then.